Infographics are a visual representation of data or information designed to make complex information more digestible (and more fun!). With the rise of content marketing, infographics are a great way to mix up your content strategy. With all of the fancy infographics around the internet, learning how to make an infographic can feel like a daunting task left best to the professionals. Luckily, we can make things easier with professionally designed infographic templates, icons, and stock photography that can all be easily customized to fit your brand and needs.
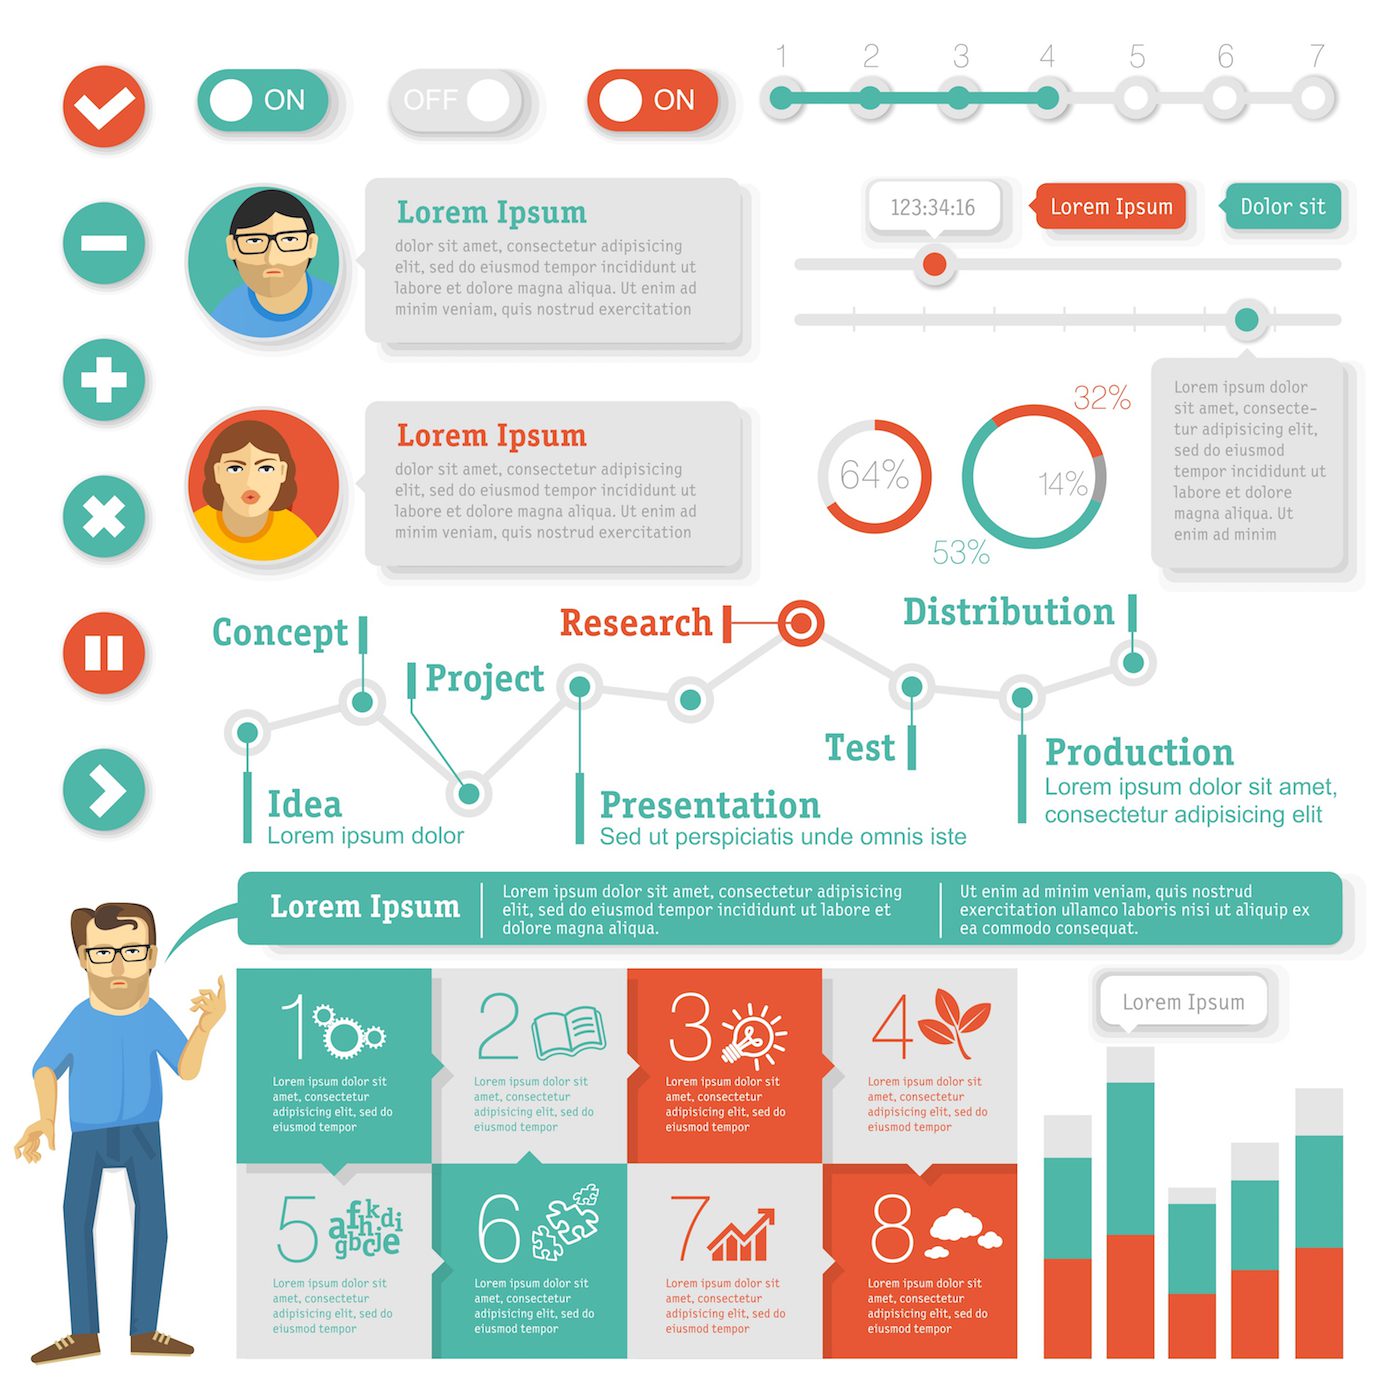
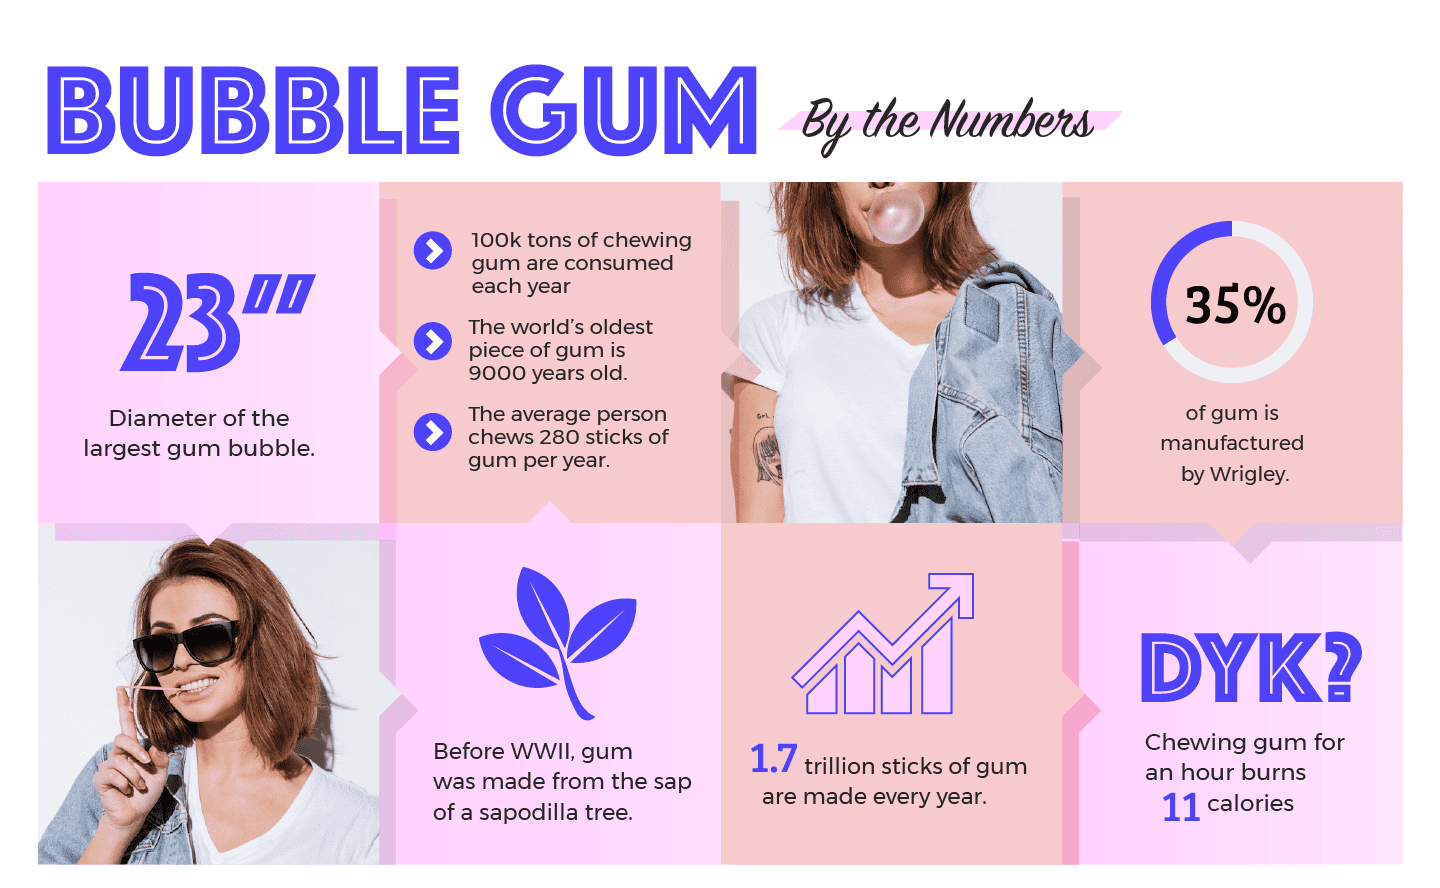
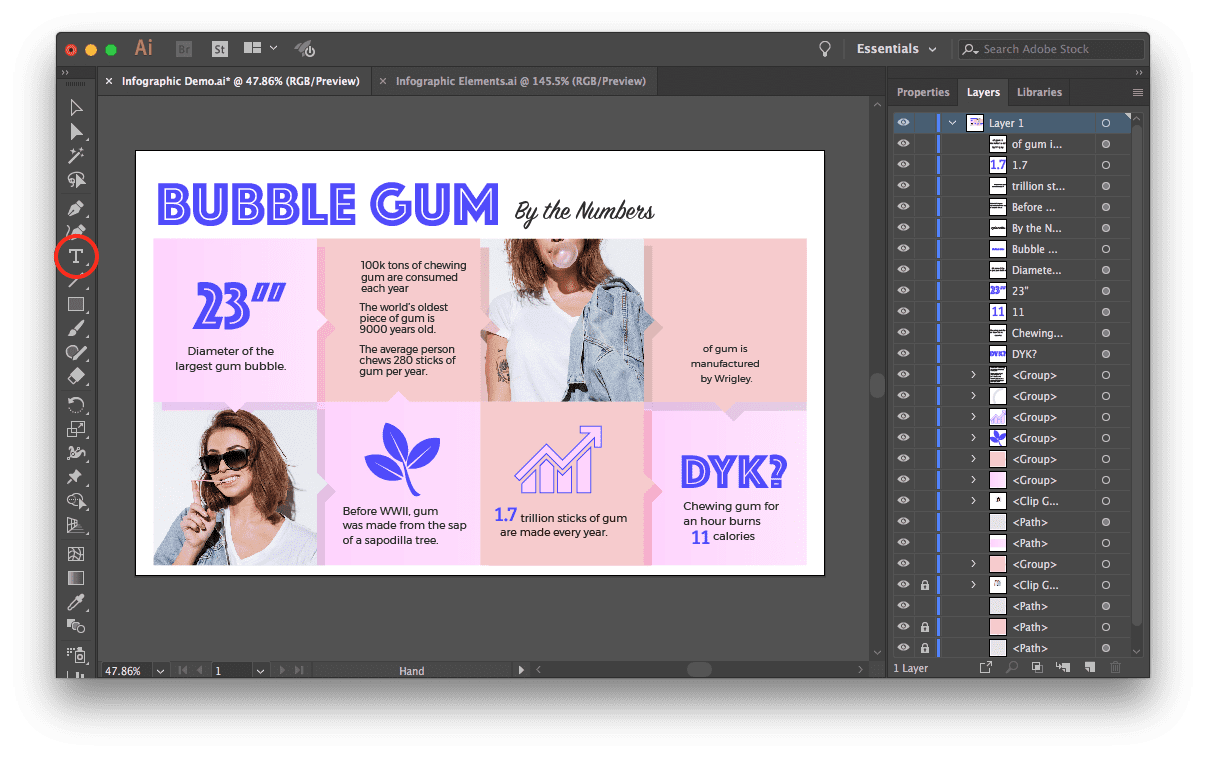
In this tutorial on creating an infographic, we’ll use parts of this infographic design element set to show you how to make an infographic full of fun facts about chewing gum. See the before and after below.
Find Elements to Make Your Infographic
Before you begin downloading every design element you like (although with unlimited downloads from our library, have at it!) consider how your data will best be represented. If you have a lot of comparative, numerical data, using a template with charts and graphs may work best. Timeline infographics are great for historical information, and icon graphics work well for a “fast facts” style. With a little customization, you can even combine different templates and elements together to fit your information best. When browsing for elements, keep in mind that all of the colors are customizable, so don’t pass over the perfect infographic template just because the colors aren’t right!
Get Set Up in Adobe Illustrator
For this example, we’ll start with a blank document in Illustrator and we’ll open the downloaded .eps file in a separate tab, preparing to copy and paste desired sections over to the new document.
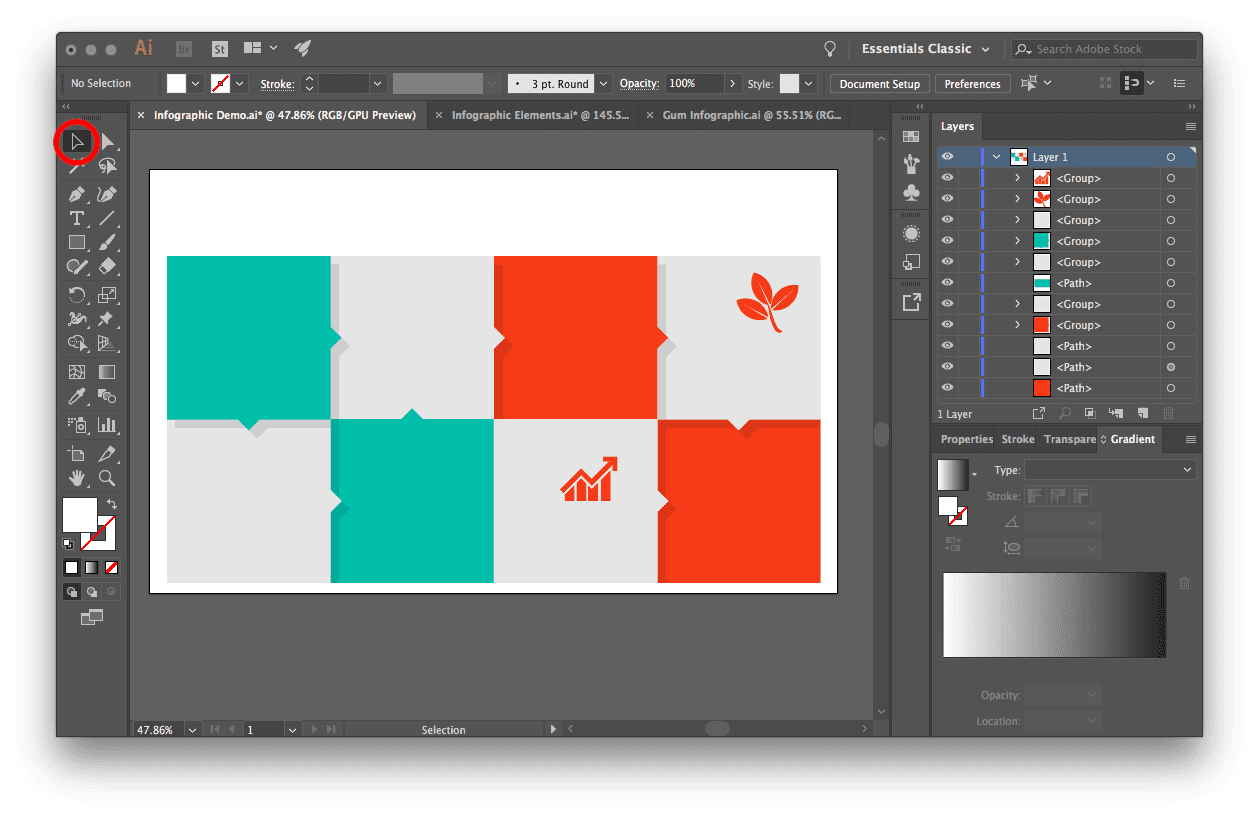
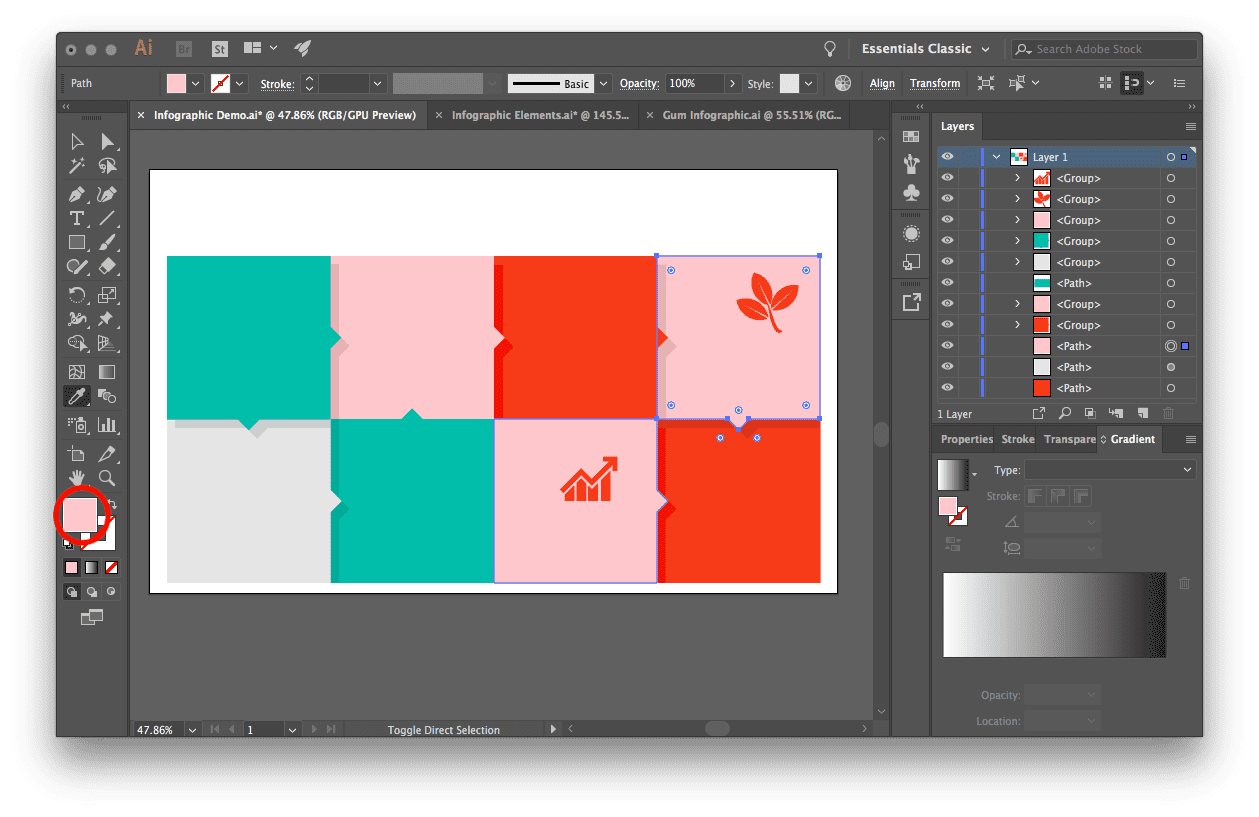
Upon opening the downloaded file, take a moment to scope it out. You can see all of the layers, paths, and groups by opening the Layers Panel (Window > Layers). Click the eyeball icons to hide and show groups and paths. Select individual paths by using the Direct Selection Tool (A) to click on the path directly. Use the Selection Tool (V) to select a group. Navigate to Object > Ungroup if you want to break up a group indefinitely.
We’ll start by using these tools to select the parts we want and copying them over to the blank document. Keep the design elements tab open to grab more individual items later.
Changing the Colors of the Infographic Template
First, determine your color palette. Your palette could be created using existing brand colors or colors chosen specifically for your infographic. Adobe Color is a great resource for selecting colors that go together if you’re starting from scratch.
Start by clicking the object or group you want to recolor, and click the Fill Box to choose a new color. If you want to change all of one color to a new color, select one shape in that color and go to Select > Same > Fill Color to select everything of that color. Then, simply choose your new fill color.
For the next box, we’ll add a gradient just to keep things interesting. Select the object to recolor and choose the Gradient Fill Box to pick two colors to make up your gradient. We’ll use two similar shades of pink so the effect is subtle.
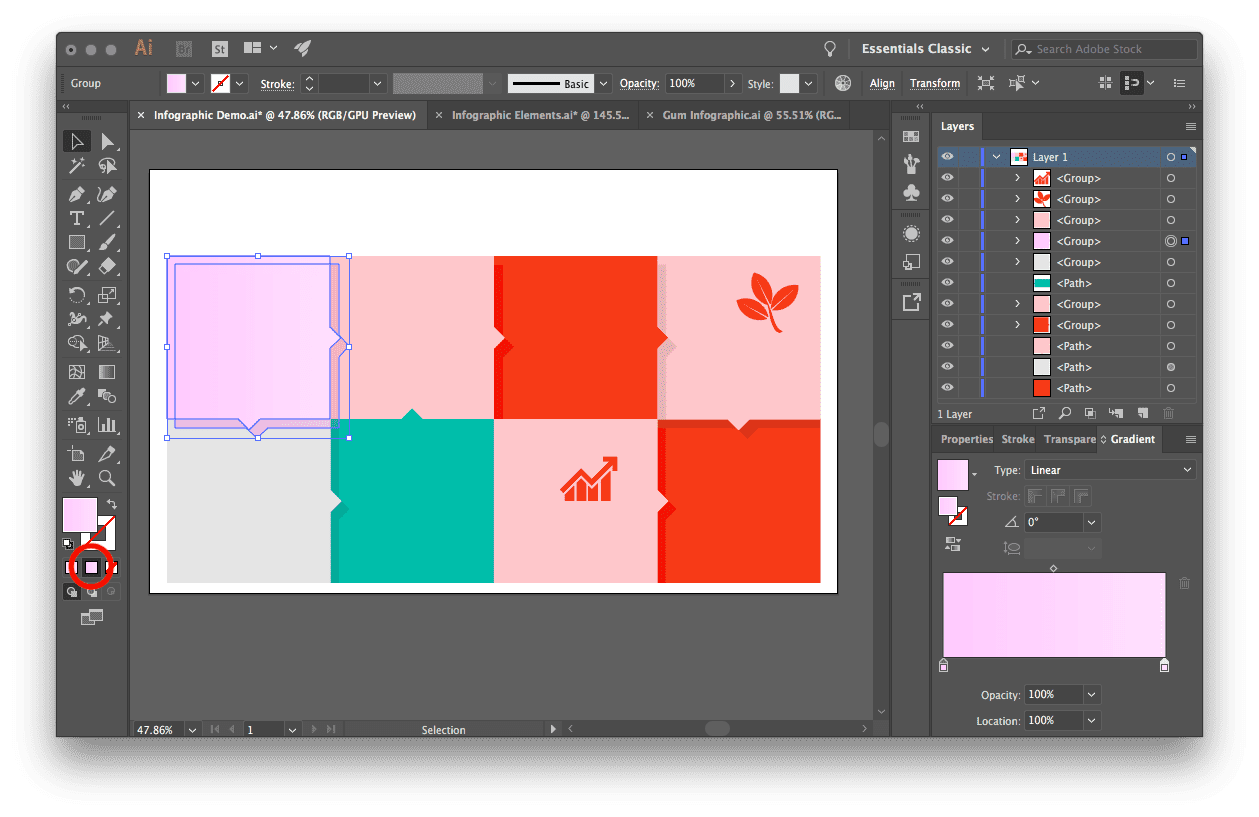
To add the same solid or gradient fill to some other squares, we can select another square and use the eyedropper tool to click the desired color.
Incorporate Photos with Clipping Masks
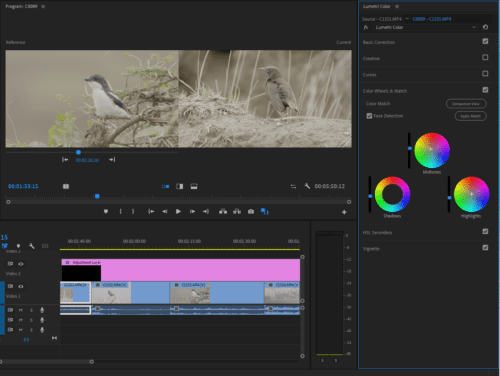
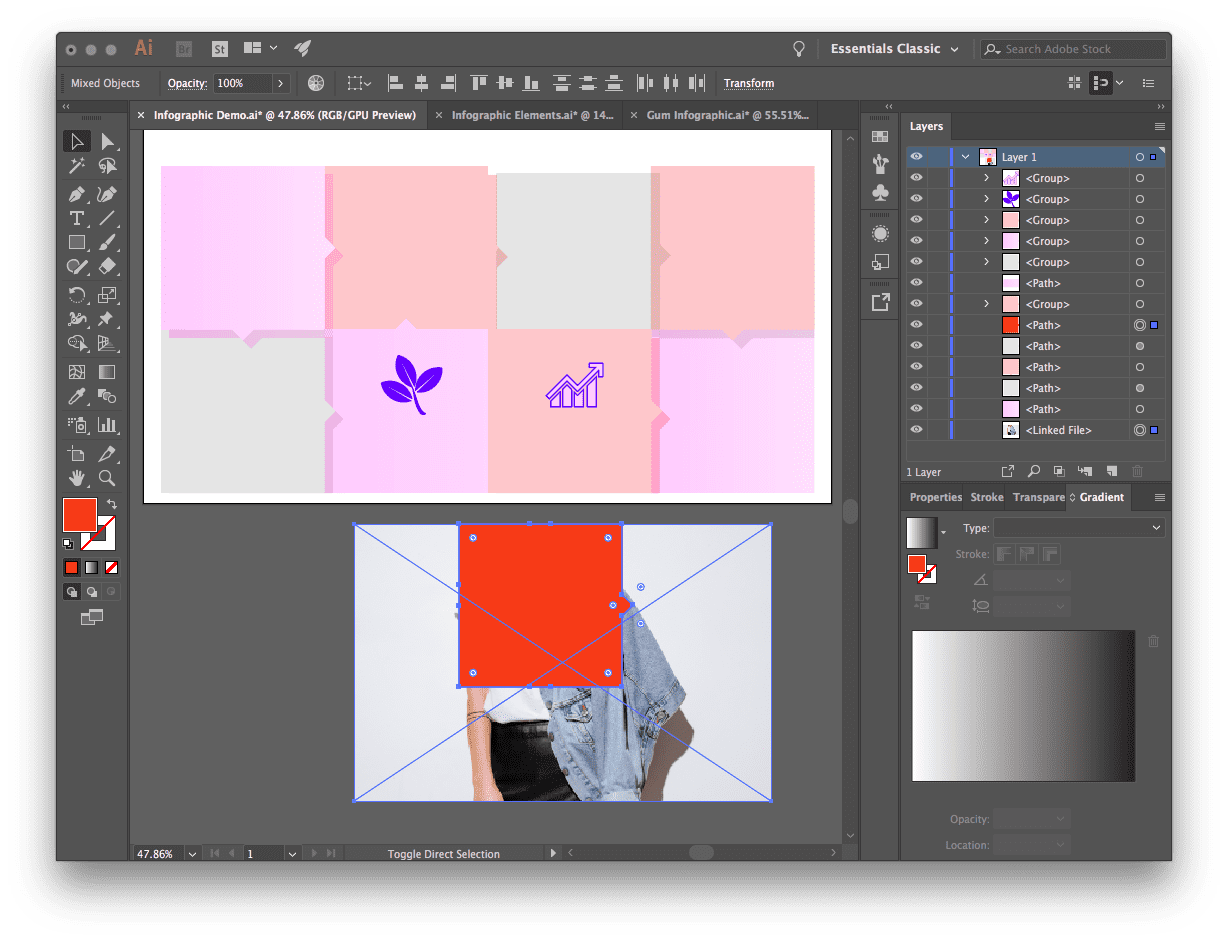
Photos are a great way to add unexpected pizazz to an infographic, and clipping masks are the perfect tool to work them into your design. A clipping mask is a simple way to crop a photo to fit a shape or path. Here we’ll use this photo, and this photo of a trendy girl chewing gum to keep with the theme. We’ll start by dragging and dropping the photo into our Illustrator document, then dragging the desired shape over it. Right-click > Bring to Front if the shape isn’t on top. Finally, ensure the shape isn’t grouped with any other objects (Object > Ungroup). To create the mask, select both objects, and go to Object > Clipping Mask > Make (or on a Mac, command/control-7). After creating the clipping mask, drag and drop the photo to the desired position.
Change the Text in an Infographic Template
For the most part, text found in templates is in the form of a path—in other words, not editable text. While you’ll get design inspiration from the template, typically you will need to remove the text completely and add new text with the Text Tool. Consider playing with color and size variations, and try Google Fonts if you need some fresh fonts. #ProTip: use the eyedropper tool to quickly apply an existing style to selected text.
Make Finishing Touches to Your Infographic
Copy and paste over any additional icons or graphics. In this case, there’s a circle shape to display a percentage and some arrow icons that will look great for highlighting fast facts. While making these tweaks, try using the Lock feature to lock elements in place so you don’t accidentally move other elements around. Just select objects to lock and go to Object > Lock > Selection (or command/control-2). It can also be helpful to group and ungroup objects as you work. Select objects to group and go to Object > Group (or command/control G).

And there you have it—now you know how to make an infographic by using an infographic template and infographic elements as a starting point! With these tools, it’s possible to create a simple infographic for social media or a scrollable masterpiece for a website.